WBCSD 회원사 27곳을 중심으로 살펴본 물리적 기후위험 평가 사례 분석
(7월 WBCSD)
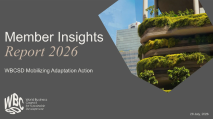
Ask a company today whether it understands its physical climate risks, and the answer is almost always yes. Ask whether it’s built anything to actually manage them, and the room gets quieter. That gap ran through nearly every one of the 27 conversations behind this year’s Member Insights Report:
Board support is growing. Turning it into budget and implementation is the next step
Three years ago, the conversation looked different. When we interviewed members for our 2023 Member Insights Report, securing senior leadership buy-in was consistently identified as one of the biggest barriers to advancing climate adaptation. This year, that barrier appears to be easing: 52% of interviewed companies said board-level support for adaptation is now in place.
But support hasn’t always translated into commitment at the next level:
Only a third of companies have set, or are setting, formal adaptation goals, and none yet have a dedicated adaptation budget, though a third are working toward one.
Many companies are already implementing adaptation solutions. For some, this is happening through a group-wide, consolidated plan; but for many others, it’s still ad hoc or site-specific, driven locally rather than centrally coordinated. Several companies also described adaptation happening quietly, without being tied to any formal strategy.
Monitoring and evaluation lags furthest behind, and this isn’t unique to WBCSD members: S&P Global Ratings’ analysis of 70 European investment-grade companies in climate-sensitive sectors found the same gap, with monitoring & evaluation and metrics & targets both averaging 0% maturity across their sample.
Adaptation is spreading across business functions
Sustainability teams are no longer the primary drivers of this work. Local sites and business units, alongside risk and business continuity teams, operations, R&D, supply chain, and finance, are increasingly playing important roles. That breadth is a sign adaptation is maturing, but it also raises a question companies are still working out: as more teams get a stake in adaptation, who owns it, and how should it integrate into existing business processes?
Three needs, echoed across sectors
Leading and lagging companies appeared across every sector we spoke with. Across sectors and company sizes, the same three needs came up repeatedly:
Measuring the value of adaptation. Without credible, shared methodologies for quantifying resilience benefits, it’s hard to build the business case that unlocks investment.
Embedding adaptation into governance. Companies want clearer structures for ownership, and better ways to fold adaptation into planning processes that already exist, rather than running it as a parallel effort.
Collective, system-level resilience. Even a well-adapted company remains exposed if key areas beyond its fenceline (its suppliers, infrastructure, or surrounding communities) remain vulnerable. Many interviewees made the same point: individual resilience only goes so far if the systems around a business haven’t adapted too. Addressing this will require coordinated action across value chains and with peers, public partners, and other stakeholders.
Where this leads
These insights into practical blockers standing between companies and building resilience are already shaping WBCSD’s work focused on adapting to physical risks.
Particularly through Open Sesame, a joint initiative with the Federation of European Risk Management Associations (FERMA), WBCSD aims to build a unified framework for financing climate adaptation and resilience. Working on consistent climate exposure modelling, credible measurement of risk-reduction from adaptation measures, and clearer frameworks for evaluating resilience investments.
This is one example of the direction WBCSD’s work is heading: working with businesses to quantify the value of adaptation, embed it more deeply into decision-making and governance, and act decisively to reduce their risk exposure.
Many companies are ready to scale their adaptation action. The next step is turning that recognition into measurable, funded, and coordinated action. This is where we see the real progress in the years ahead being made.
출처: https://www.wbcsd.org/resources/most-companies-are-already-assessing-their-physical-risks-but-why-is-implementation-still-a-challenge/
첨부파일: https://www.wbcsd.org/resources/most-companies-are-already-assessing-their-physical-risks-but-why-is-implementation-still-a-challenge/
2026.08.20







(1).jpg)
.jpg)




































































 About KBCSD
 회원사 소개
 회원사지속가능보고서
 KBCSD 가입신청